Pre-Feasibility Study
On June 26, 2024, the Company released the Pre-Feasibility Study (“PFS”) results for the 100% owned Silver Sand Project in Potosi Department, Bolivia (the “Project”). The PFS study confirms the potential to develop a high-grade, low-cost conventional open pit and tank leach operation at Silver Sand, producing on average 12 million ounces (“Moz”) of silver (Doré) per annum over a 13-year mine life.
The PFS is based on the Mineral Resource Estimate (the “MRE) for the Project, which was reported on November 28, 2022 and is reported in accordance with National Instrument 43‐101- Standards of Disclosure for Mineral Projects (“NI 43‐101”).
PFS Highlights ($ figures in USD):
Compelling project economics – Base Case post-tax net present value (“NPV”) (5%) of $740 million and an internal rate of return (“IRR”) of 37% at $24.00/oz silver
Leveraged to silver – Using a +/- $6/oz sensitivity analysis for silver price, post-tax NPV (5%) of $1,124 million and 48% IRR at US$30/oz silver and a post-tax NPV (5%) of $329 million and 22% IRR at US$18/oz silver
Large-scale, long mine life asset – 13-year mine life producing approximately 157 Moz total payable silver metal
Annual payable metal production exceeds 15 Moz of silver in years one through three, with life-of-mine (“LOM”) average annual payable metal production exceeding 12 Moz of silver
High-margin operation – Average LOM all-in sustaining cost of $10.69/oz silver
Low capital intensity – Initial capital costs of $358 million; LOM sustaining capital costs (including closure costs) total $85 million
Silver Sand Project Open Pit Mining — Key Economic Assumptions and Results (Base Case)
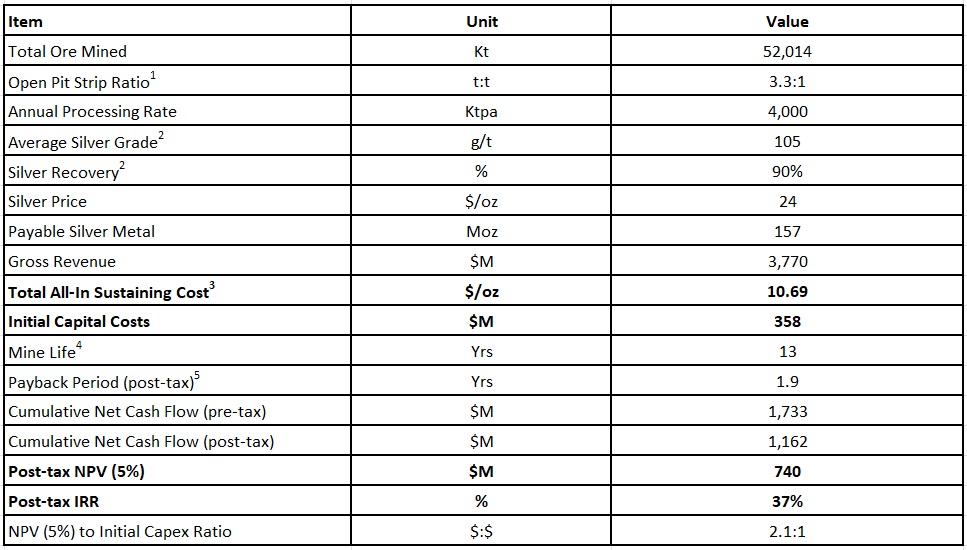
- LOM average strip ratio. Does not consider material mined during the pre-production period.
- LOM average.
- Includes operating costs, selling costs, royalties, sustaining capital costs, and closure costs.
- Excludes pre-production period.
- The payback period is measured from the beginning of production after construction is completed.
Silver Sand Project Economic Sensitivity Analysis for Selling Prices – Post Tax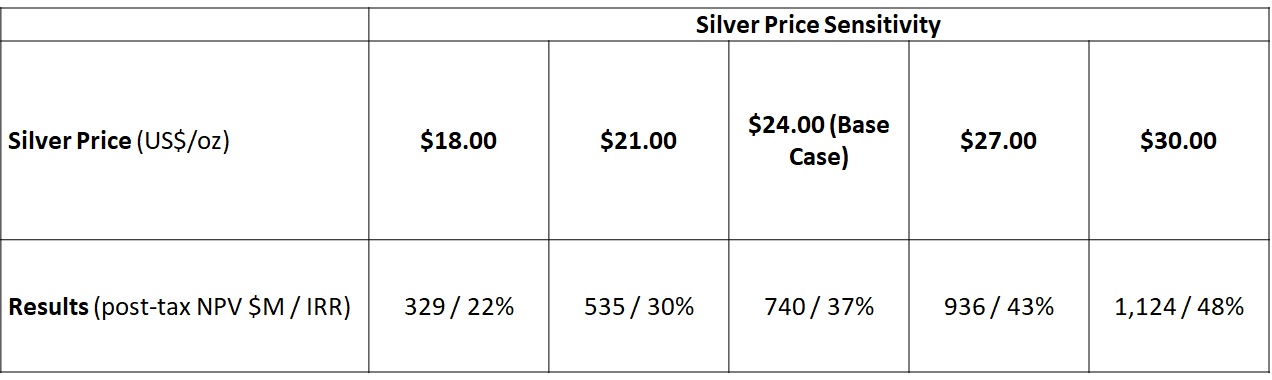
Note: Inputs for the base case (100%) are listed in the Silver Sand Project Open Pit Mining – Key Economic Assumption and Results table. This table presents how the project’s post-tax NPV and IRR are affected by varying the selling price of silver. NPV values are discounted at a rate of 5% per annum. For example, if the silver price increases by $3/oz (from $24.00 to $27.00/oz) while other Inputs remain as the “Base Case”, then the NPV becomes $936 M and IRR is 43%. NPV values are discounted at a rate of 5% per annum.
Silver Sand Project Economic Sensitivity Analysis for Costs – Post Tax 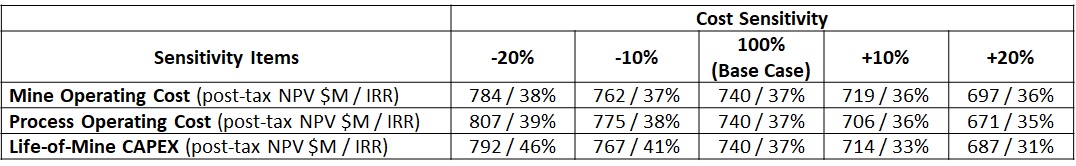
Note: Inputs for the base case (100%) are listed in the Silver Sand Open Pit Mining – Key Economic Assumption and Results table. This table lists sensitivity analysis for three “Input” variables. For example, if LOM CAPEX increases by 20% (+20%), while silver price, mine operating cost, and process operating cost remain the same as the “Base Case” input, the NPV becomes $687 M and IRR is 31%. NPV values are discounted at a rate of 5% per annum.
Total Capital Cost Estimates 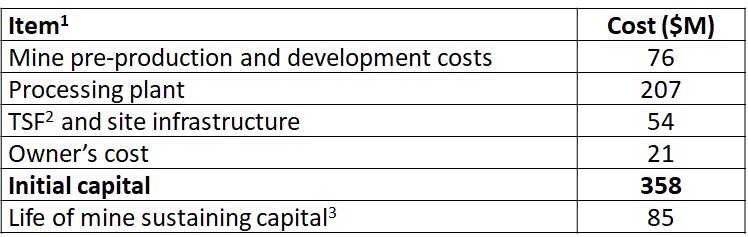
- Includes direct, indirect, and contingency costs.
- Tailings capital includes initial earthworks, liners/membranes, and a water management facility. The cost of transporting material to build the tailings embankment is included in mine pre-production and development costs. Ongoing tailings embankment costs are included in mine operating costs and sustaining capital.
- Sustaining capital costs include expansion of the TSF, refurbishment and replacement of processing equipment, and mine closure.
Total Operating Cost Estimates
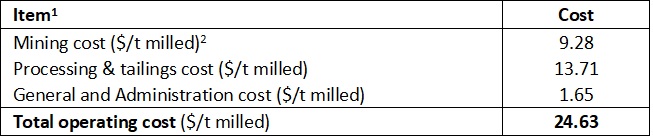
- Totals may not add up exactly due to rounding.
- Does not include capitalized pre-production costs, $9.28/t milled includes a credit for 3.8 Mt of ore mined during the pre-production phase and is based on a mining cost $2.34/t mined
AMC Mining Consultants (Canada) Ltd. (mineral resource and reserves, mining, infrastructure and financial analysis) was contracted to conduct the PFS in cooperation with Halyard Inc. (metallurgy and processing), and NewFields Canada Mining & Environment ULC (tailings, water and waste management). The taxation calculations were based on the guidance and expertise of Bolivian local experts engaged by the Company.
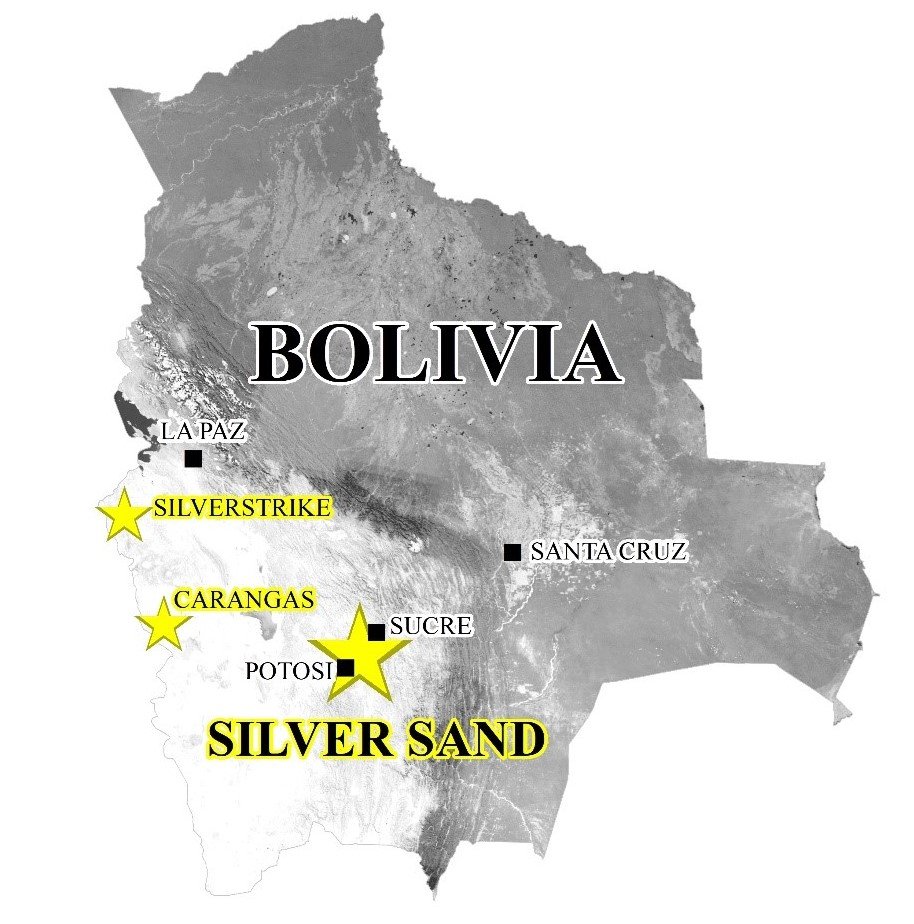
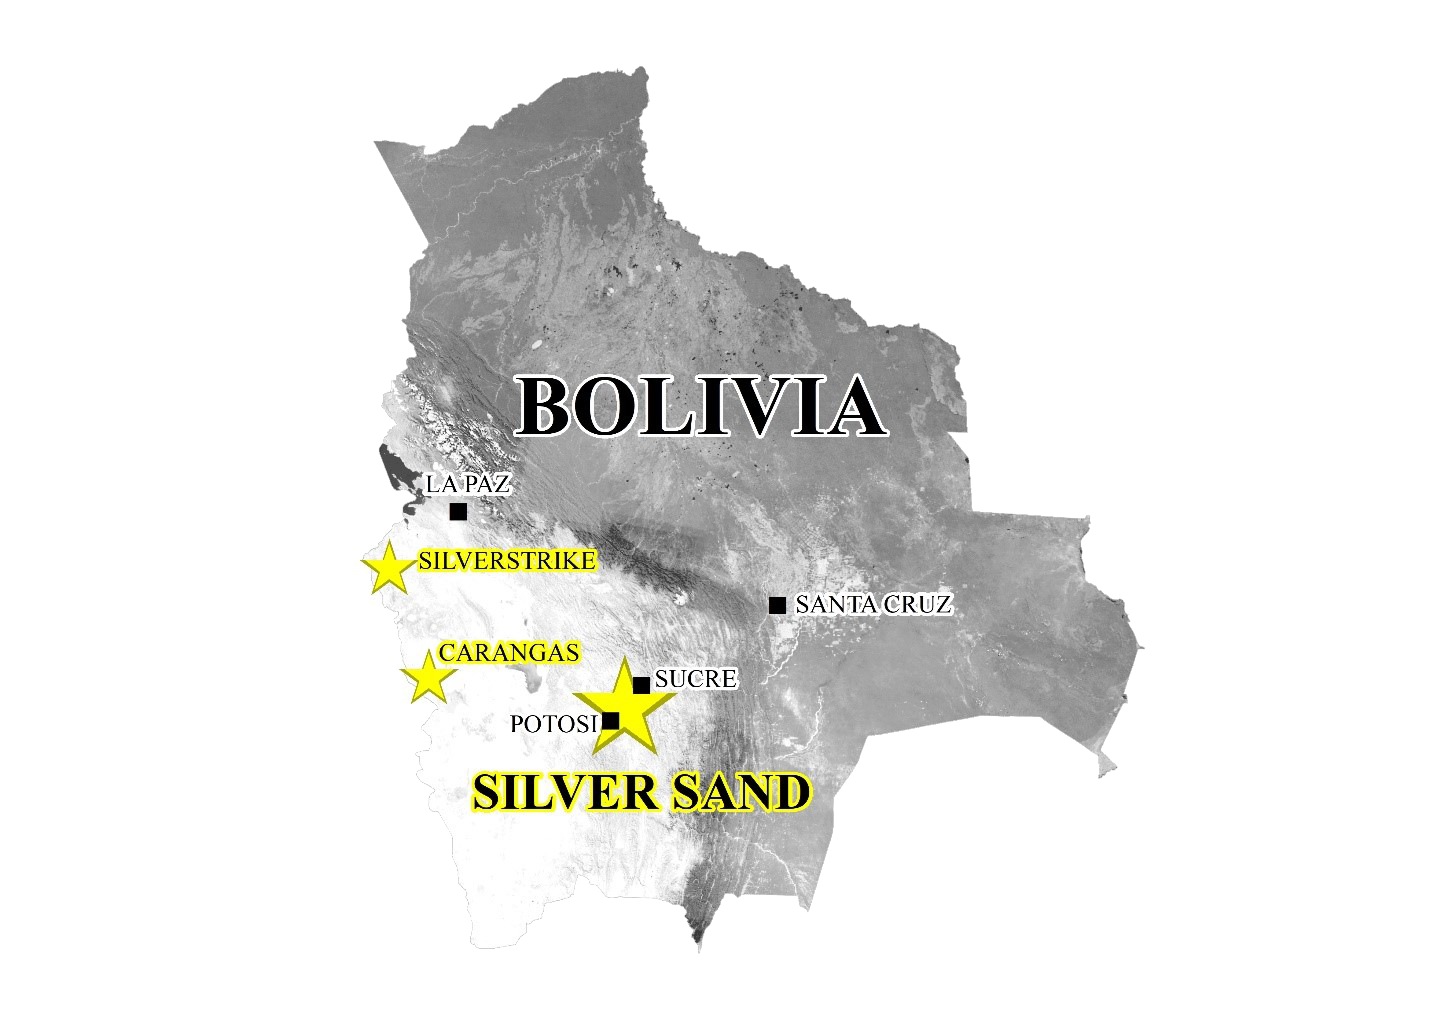
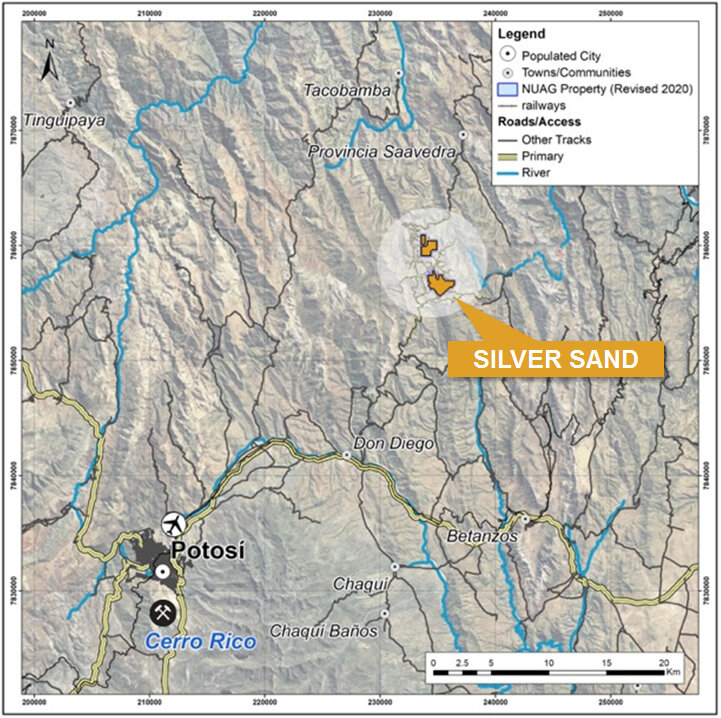
Location and Access
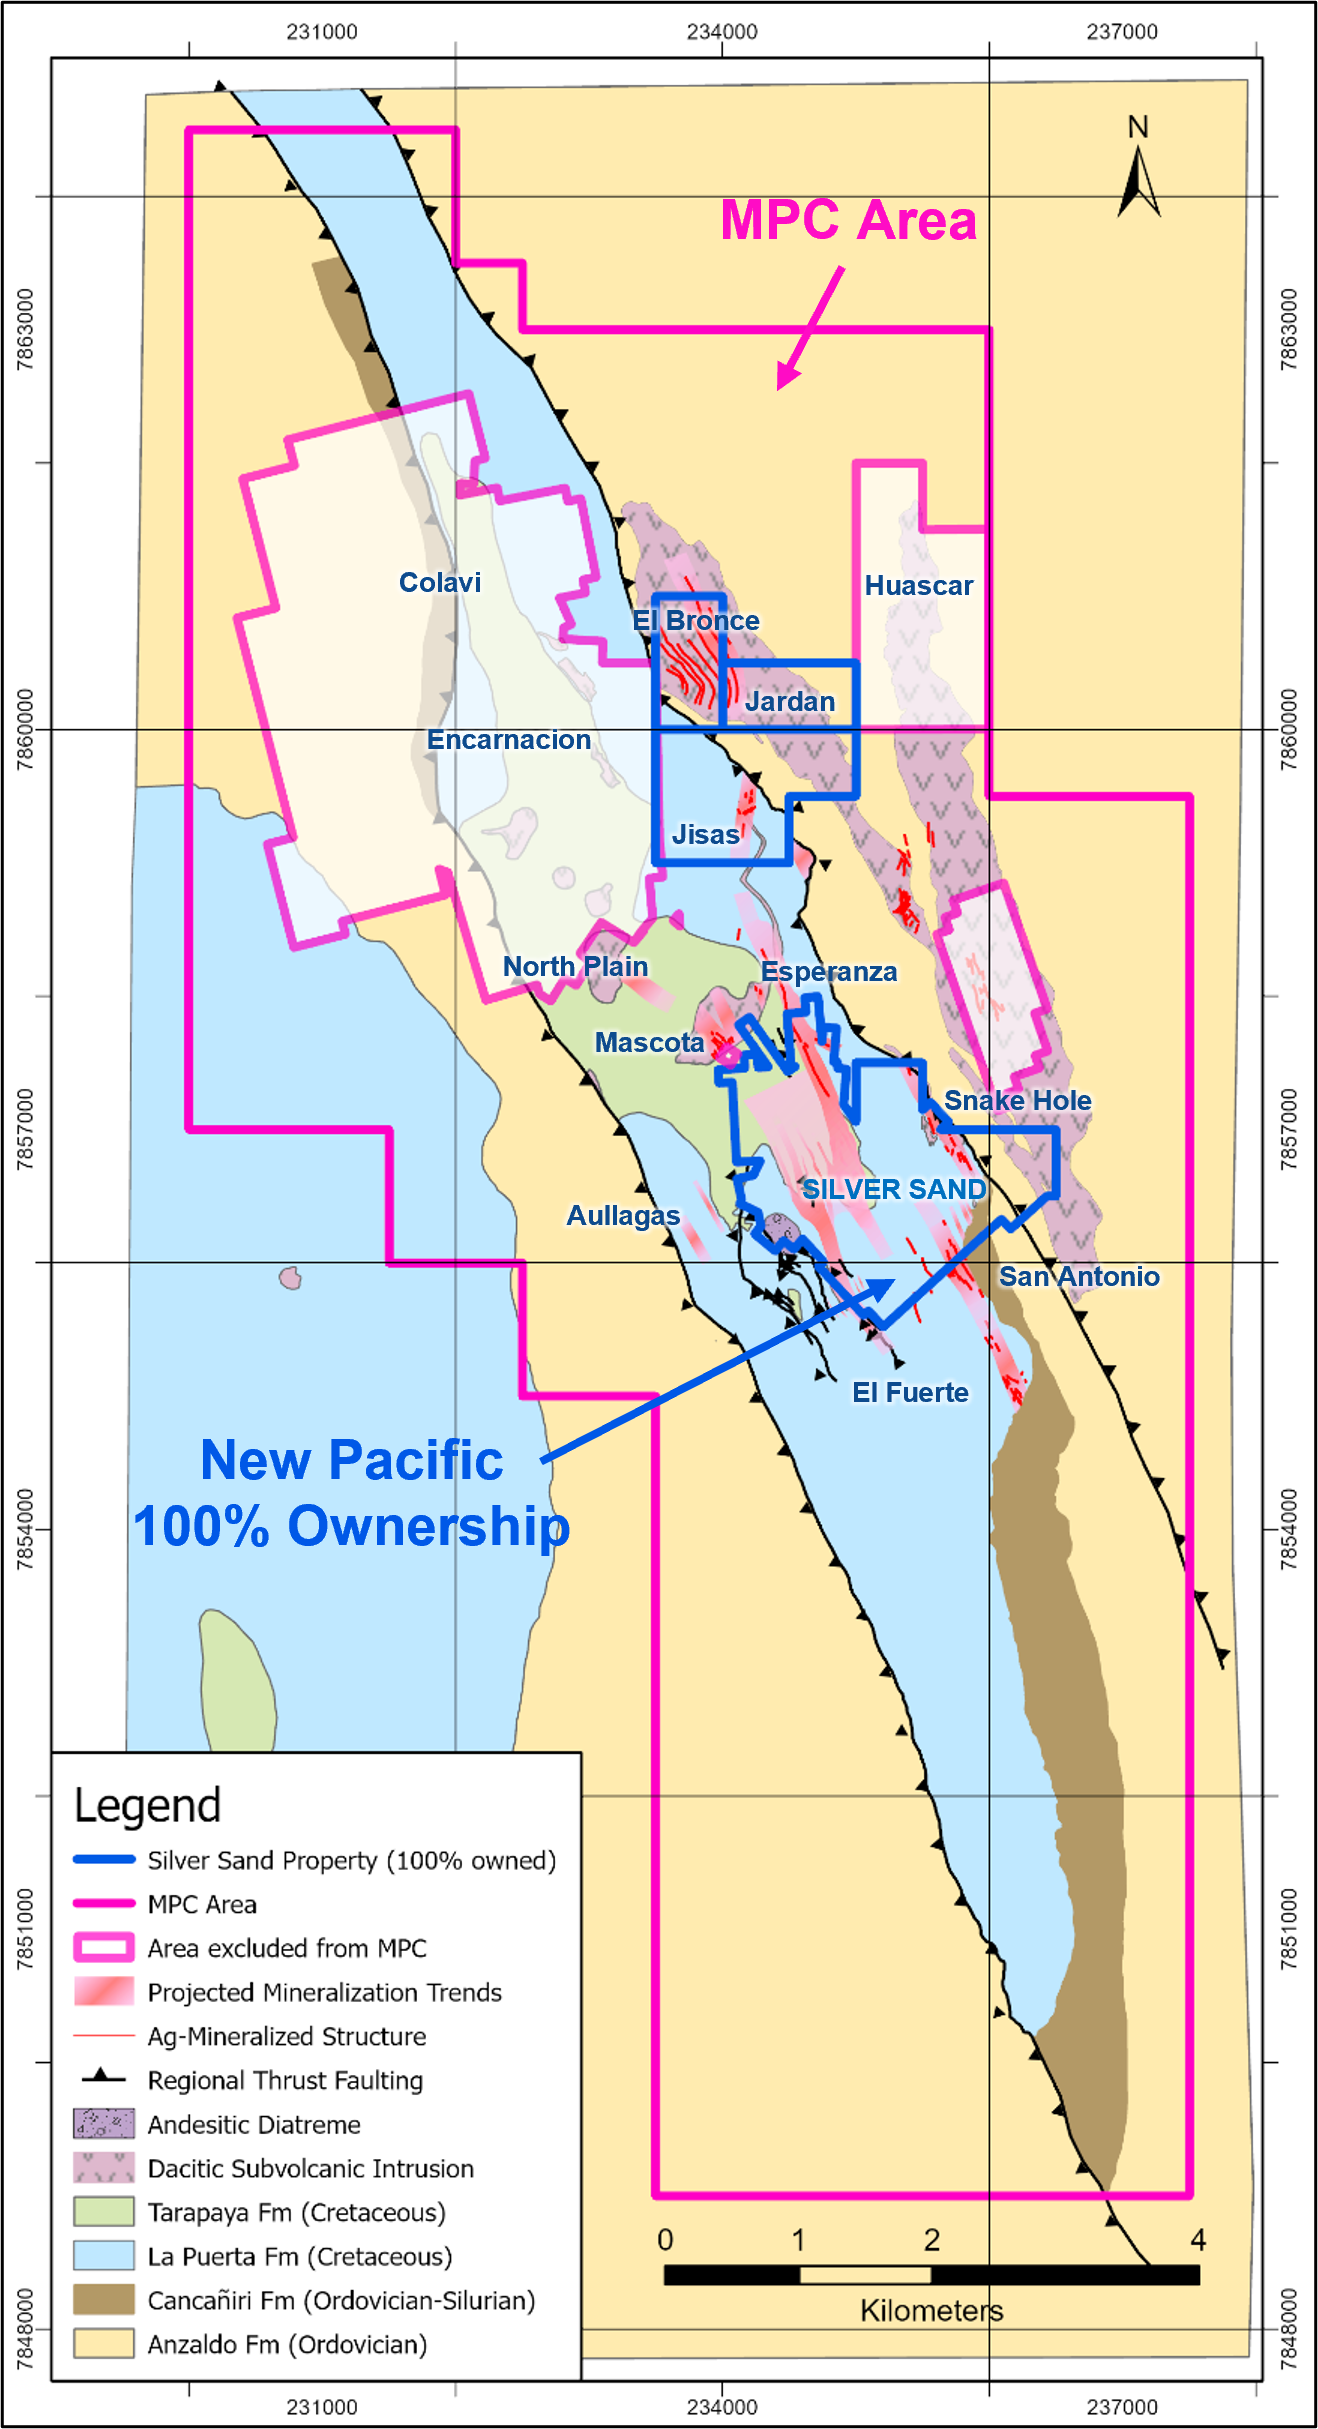
The flagship Silver Sand Project is located ~35 km northeast of the world-class Cerro Rico silver and base metal mineral system near Potosi in southwest Bolivia.
The 5.42 km² Property sits in the Eastern Cordillera at an elevation of ~4,050 metres above sea level and consists of:
-
The 3.17 km² Silver Sand “Administrative Mining Contract” (AMC) concession hosting the core Silver Sand Deposit, and
-
The Jisas, Jardan and El Bronce concessions comprising the North Block
 The Property is accessible from Potosi via a 54 km long road made up of a 27 km stretch of the paved Bolivia National Highway 5 and an all-season gravel road built for mining in the Colavi District.
Mineral Concessions & Ownership
The Ministry of Mines and Metallurgy grants exploration and mining rights in Bolivia through the Autoridad Jurisdiccional Administrativa Minera (AJAM). Under the 2014 and 2016 Bolivia Mining Laws, tenure is granted as either an exploration license for early-stage projects or an AMC for development-stage projects. Tenure held under the previous “historic” legislation was converted to Temporary Special Authorizations (ATEs), formerly known as “mining concessions”; these ATEs are required to be consolidated to new 25-hectare sized cuadriculas and then converted to AMCs. AMCs created by conversion recognize existing rights of exploration, exploitation, and development, including treatment, foundry refining/smelting, and trading. AMCs have a fixed term of 30 years and can be extended for a further 30 years if certain conditions are met. Each AMC requires ongoing work and the submission of technical work plans to AJAM.
The AMC for the Silver Sand Project, which hosts the Silver Sand deposit, covers an area of 3.17 km². The total area under full control of the Company will be 5.42 km² after completing the consolidation and conversion procedures for the North Block, which is comprised of three ATEs (Jisas, Jardan and El Bronce).
History, Geology, Mineralization
One of Bolivia’s earliest mineral discoveries, Silver Sand was discovered even before Cerro Rico in the mid-1500’s. Silver was mined in the core area by Spanish colonial settlers from the early 16th century through the 19th century; subsequently, tin was extracted from the adjacent Colavi and Canutillos mines during the Tin Baron period until the collapse of tin prices in 1985. Numerous small mine workings, artisanal mining dumps, and abandoned miners’ villages are scattered across the Property.
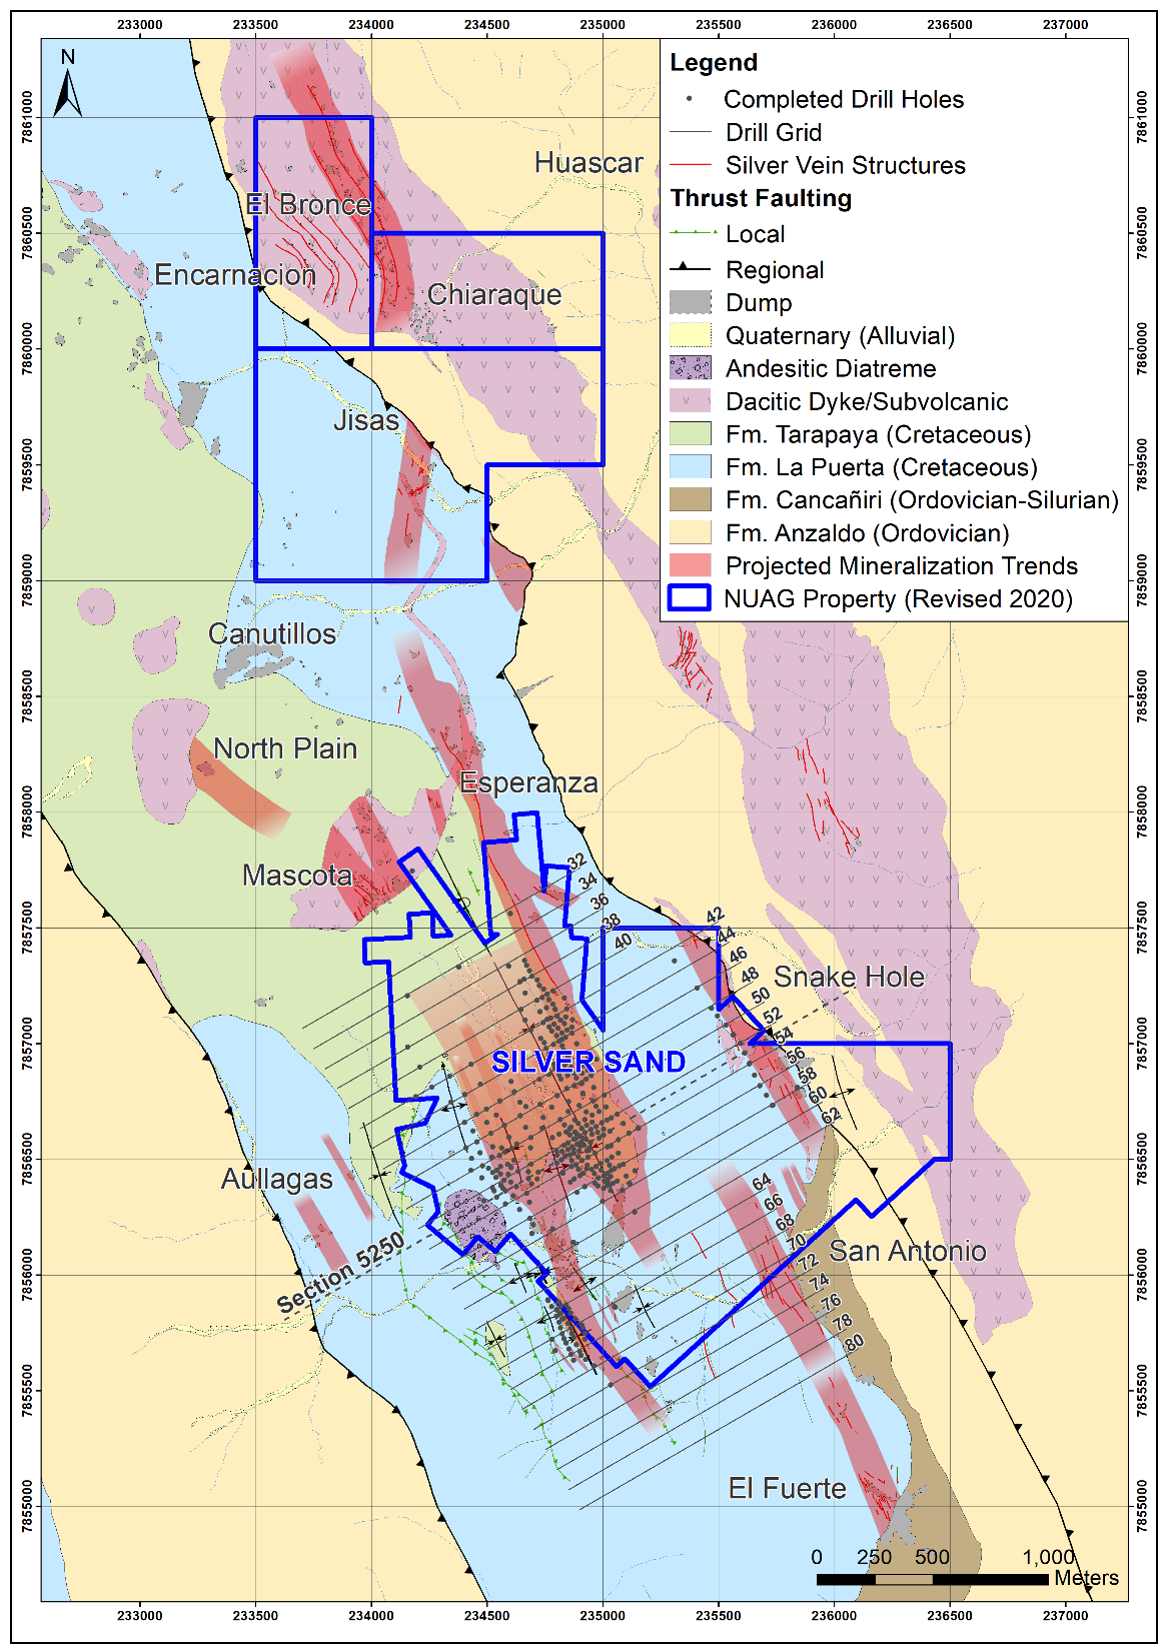
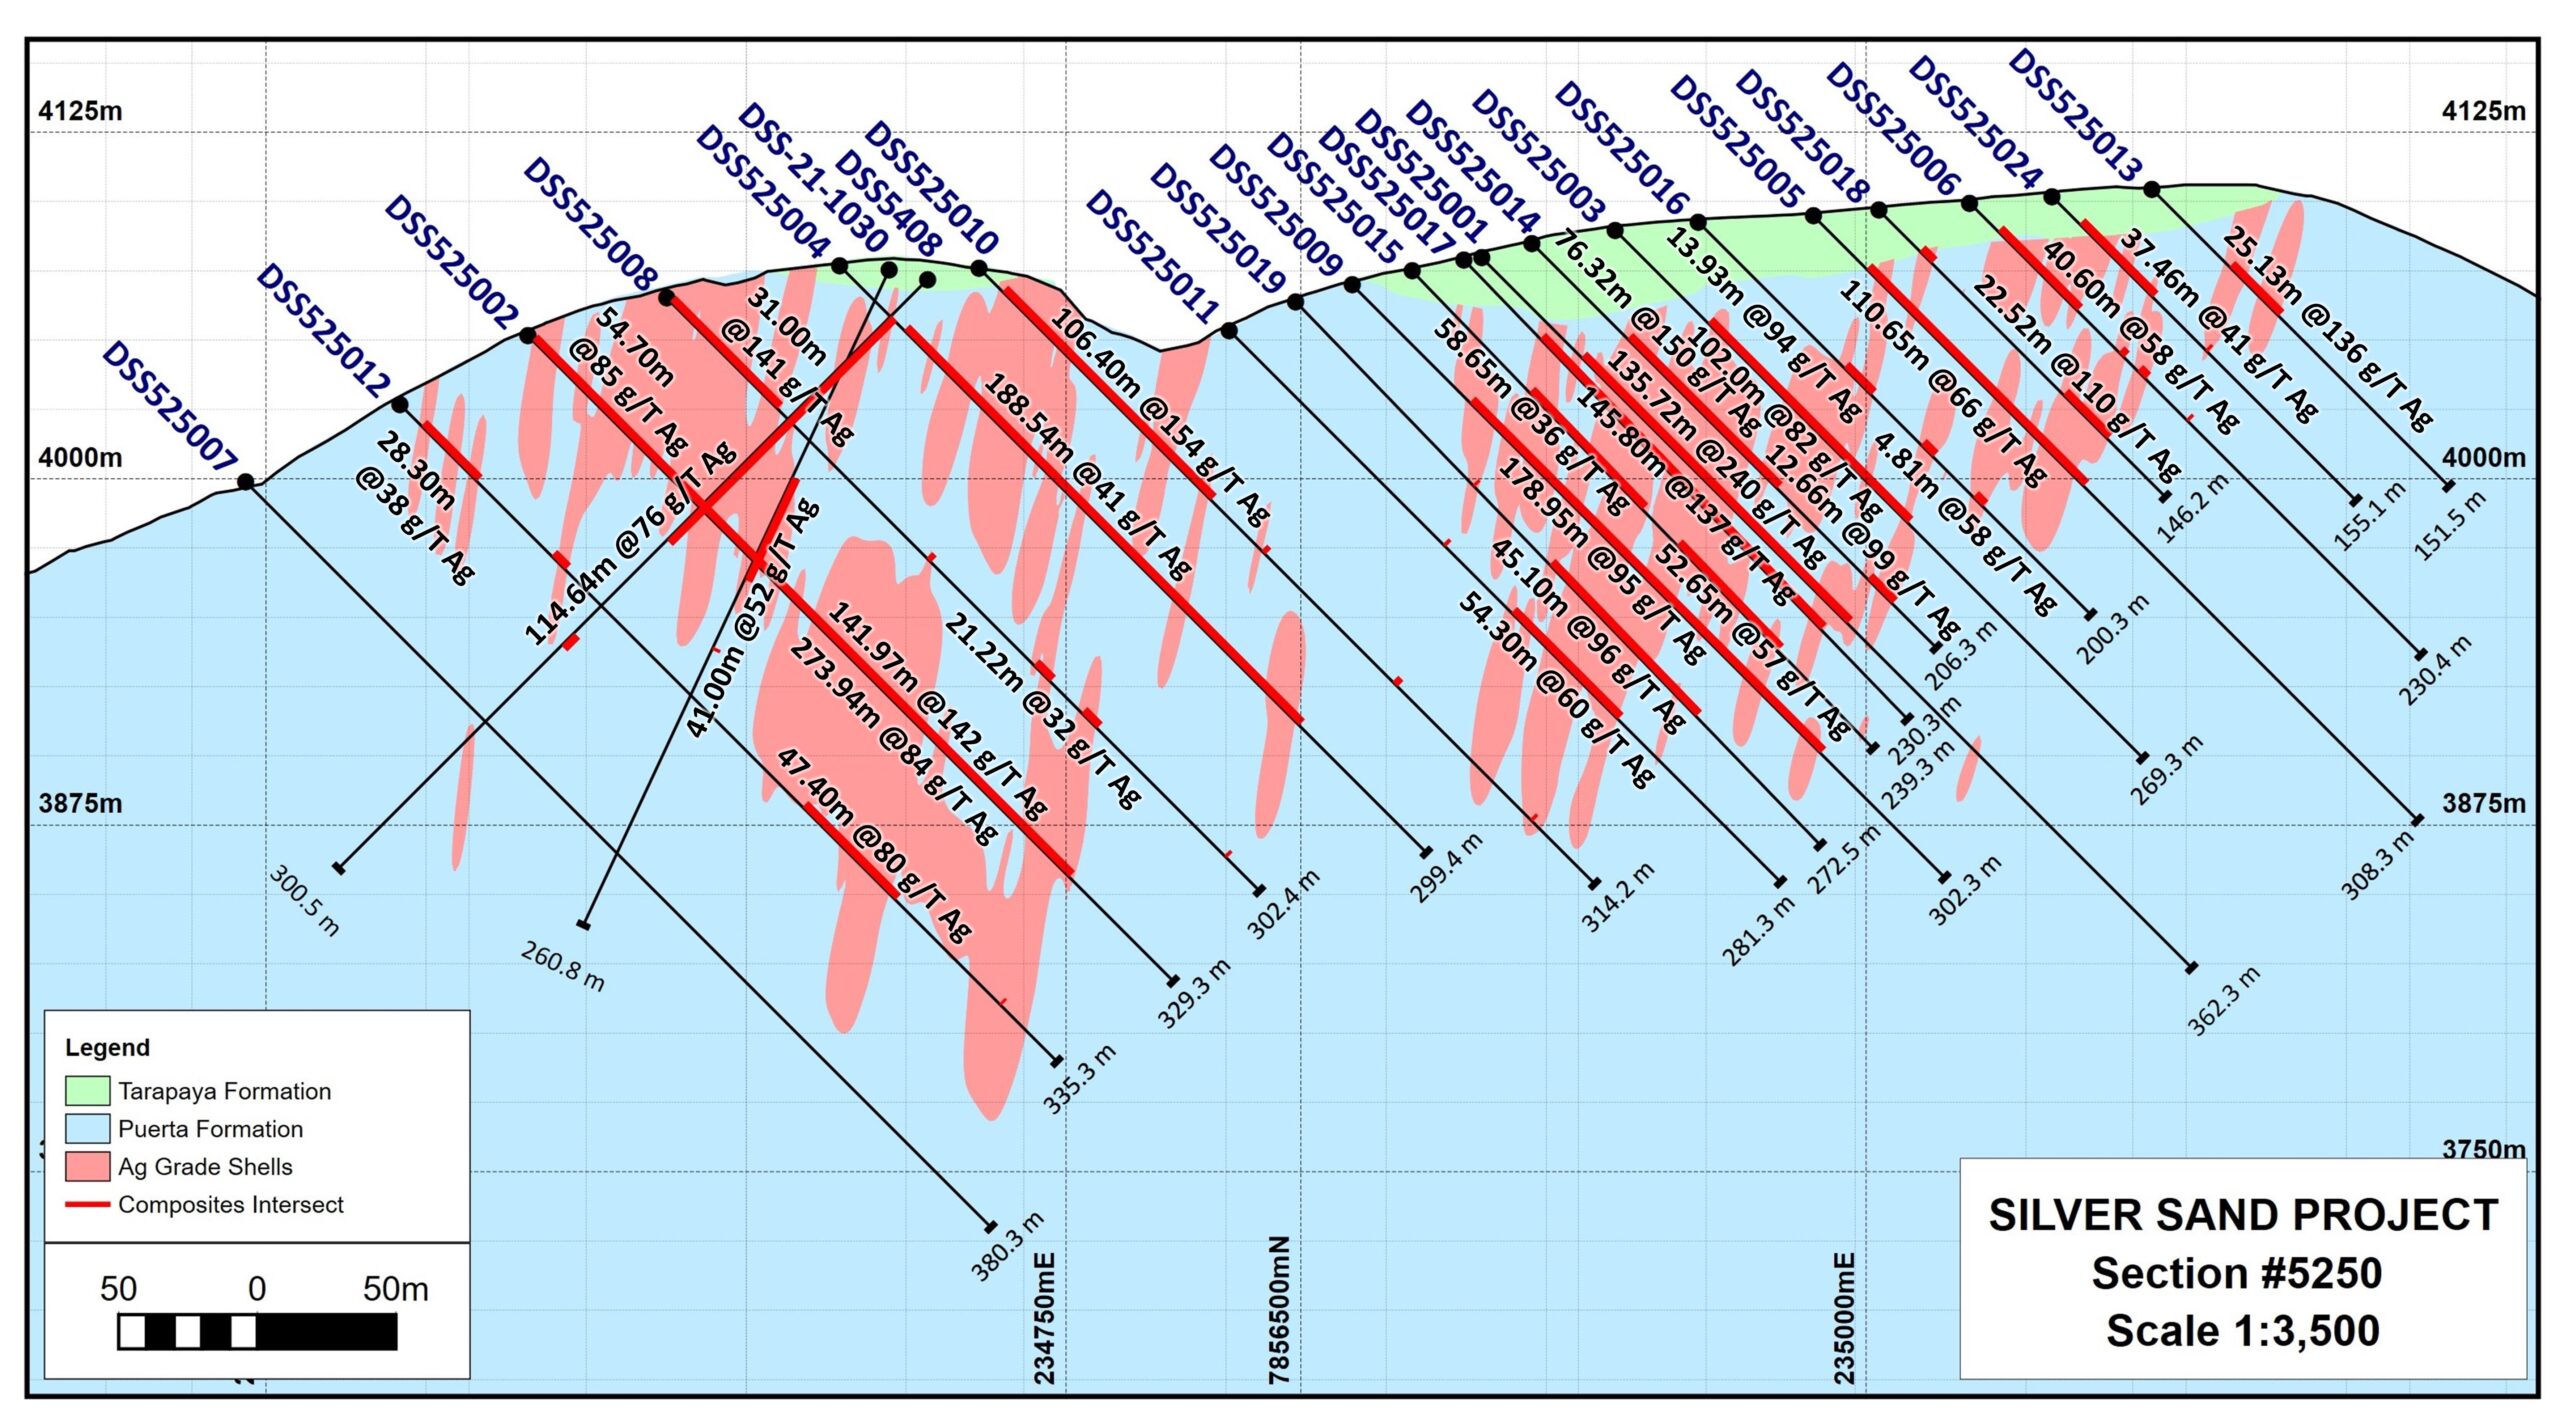
Bedrock in the Property area mainly consists of Cretaceous sedimentary units, including the lower La Puerta Formation and the upper Tarapaya Formation. The La Puerta Formation consists of sandstones unconformably overlying highly folded Paleozoic marine sedimentary rocks. The Tarapaya Formation conformably overlies the La Puerta sandstones in the central part of the Property and comprises siltstones and mudstones intercalated with minor sandstone. Both the Cretaceous and Paleozoic sedimentary sequences are intruded by numerous small Miocene subvolcanic dacitic porphyry intrusions.
Silver mineralization is hosted by faults, fractures, fissures, and crackle breccia zones in the Cretaceous La Puerta brittle sandstone and porphyritic dacitic dikes, laccolith, and stocks. Open spaces in mineralized sandstone are filled with silver-bearing sulphosalts and sulphides, occurring as sheeted veins, stockworks, and veinlets, as well as breccia fillings and minor disseminations. Most silver mineralization at Silver Sand is structurally controlled, with intensity depending on the density of various mineralized vein structures developed in the brittle host rocks.
The most common silver-bearing minerals include freibergite, miargyrite, polybasite, bournonite, andorite and boulangerite. The mineralized zones have been irregularly oxidized, which, in some areas, can result in significant mixed oxide and sulphide zones due to the strong local influence of sub-vertical fractures. Oxide minerals are dominated by jarosite, goethite and minor hematite, resulting in pervasive staining within sandstones and pseudomorphing of sulphide minerals within veins. A total of ten mineralized prospects have been identified across the Property to date, including the Silver Sand deposit and the El Fuerte, Snake Hole, North Plain, San Antonio, Esperanza, Jisas, El Bronce, Mascota, and Aullagas occurrences.
Four mineralization types have been recognized in the Property, including (1) sandstone-hosted silver mineralization, (2) dacitic porphyry-hosted silver mineralization, (3) hydrothermal breccia-hosted silver mineralization, and (4) manto-type tin and base metal mineralization. The first three mineralization types are considered to have been developed in an epithermal environment during the late stage of the Cenozoic orogenic movement in the Eastern Cordillera. They are typical of the Bolivian polymetallic vein-type deposits represented by the giant Cerro Rico de Potosí silver mine in Potosí. The manto-type tin and base metal mineralization was formed by metosomatic replacement associated with a mesothermal environment during the early stage of the Cenozoic orogenic event.
The scientific and technical information contained herein has been reviewed and approved by Alex Zhang, P. Geo., Vice President of Exploration, who is a Qualified Person for the purposes of National Instrument 43-101 — Standards of Disclosure for Mineral Projects (“NI 43-101”). The Qualified Person has verified the information disclosed herein using standard verification processes, including the sampling, preparation, security and analytical procedures underlying such information, and is not aware of any significant risks and uncertainties or any limitations on the verification process that could be expected to affect the reliability or confidence in the information discussed herein.
Please see the NI 43-101 Technical Report titled “Silver Sand Deposit Mineral Resource Report (Amended)”, with a January 16, 2020 effective date and a June 3, 2020 amended date for details.
Mineral Resource Estimates
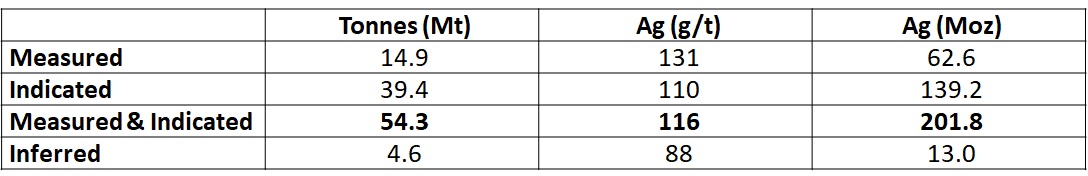
The Mineral Resource Estimate (“MRE”), which used conceptual open pit mining constraints for reporting purposes, has been reported in the news release of November 28, 2022. The Mineral Resources, which are stated at a 30 g/t silver cut‐off grade, are shown in the table below.
Mineral Resource as of October 31, 2022
Notes:
- CIM Definition Standards (2014) were used for reporting the Mineral Resources.
- The qualified person (as defined in NI 43-101) is Dinara Nussipakynova, P.Geo. of BBA, formerly employed with AMC Consultants (Canada) Ltd. (“AMC Consultants).
- Mineral Resources are constrained by optimized pit shells at a metal price of US$22.50/oz Ag, recovery of 91% Ag and cut-off grade of 30 g/t Ag.
- Drilling results up to July 25 2022.
- The numbers may not compute exactly due to rounding.
- Mineral Resources that are not Mineral Reserves do not have demonstrated economic viability.
Source: AMC Mining Consultants (Canada) Ltd.
Mineral Reserve Estimates
The open pit Mineral Reserves are reported within a pit design based on open pit optimization results. The Mineral Reserves represent the economically mineable part of Measured and Indicated Mineral Resources and are presented in the table below.
Mineral Reserve as of June 19, 2024
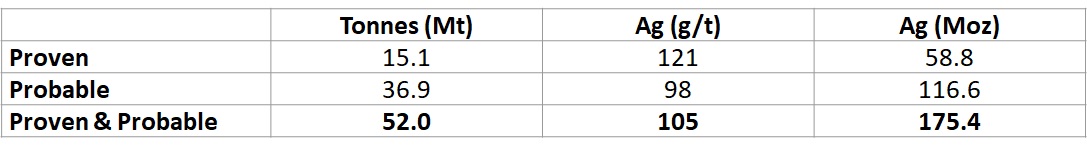
Notes:
- CIM Definition Standards (2014) were used for reporting the Mineral Reserves.
- The qualified person is Wayne Rogers, P.Eng. of AMC Consultants.
- Cut-off grade of 27 g/t Ag for material inside the AMC, and 29 g/t Ag outside the AMC limit based on operating costs of 16.71 US$/t of ore, 91% Ag metallurgical recovery, 0.50 US$/oz Ag treatment and selling costs, 6% royalty within AMC, 12% royalty outside AMC, and 99.00% payable silver.
- Ag price assumed is US$23.00 per oz.
- Mineral Reserves include dilution and mining recovery.
- Mineral Reserves are converted from Mineral Resources through the process of pit optimization, pit design, production schedule and supported by a positive cash flow model.
- The totals may not sum due to rounding.
- Probable Mineral Reserves are based on Indicated Mineral Resources only
- Proven Mineral Reserves are based on Measured Mineral Resources only.
- Ag metal (Moz) represents contained metal.
Source: AMC Mining Consultants (Canada) Ltd.
Qualified Persons
The qualified persons for the PFS are Mr. Wayne Rogers P.Eng and Mr. Mo Molavi P.Eng both Principal Mining Engineers with AMC Mining Consultants (Canada) Ltd, Mr. Andy Holloway P.Eng, Process Director with Halyard Inc., and Mr. Leon Botham P.Eng., Principal Engineer with NewFields Canada Mining & Environment ULC. This is in addition to Ms. Dinara Nussipakynova, P.Geo., Principal Geologist formerly with AMC Consultants who estimated the Mineral Resource. All such qualified persons have reviewed the technical content of the June 26, 2024 news release for the deposit at the Project and have approved its dissemination.Further details supporting the PFS will be available in an NI 43‐101 Technical Report which will be posted under the Company’s profile at sedarplus.com within 45 days of the June 26, 2024 news release.
The June 26, 2024 news release has been reviewed and approved by Alex Zhang, P.Geo., Vice President of Exploration of New Pacific Metals Corp. who is the designated qualified person for the Company.
CAUTIONARY NOTE REGARDING RESULTS OF PRELIMINARY ECONOMIC ASSESSMENT
Exploration Potential at Silver Sand
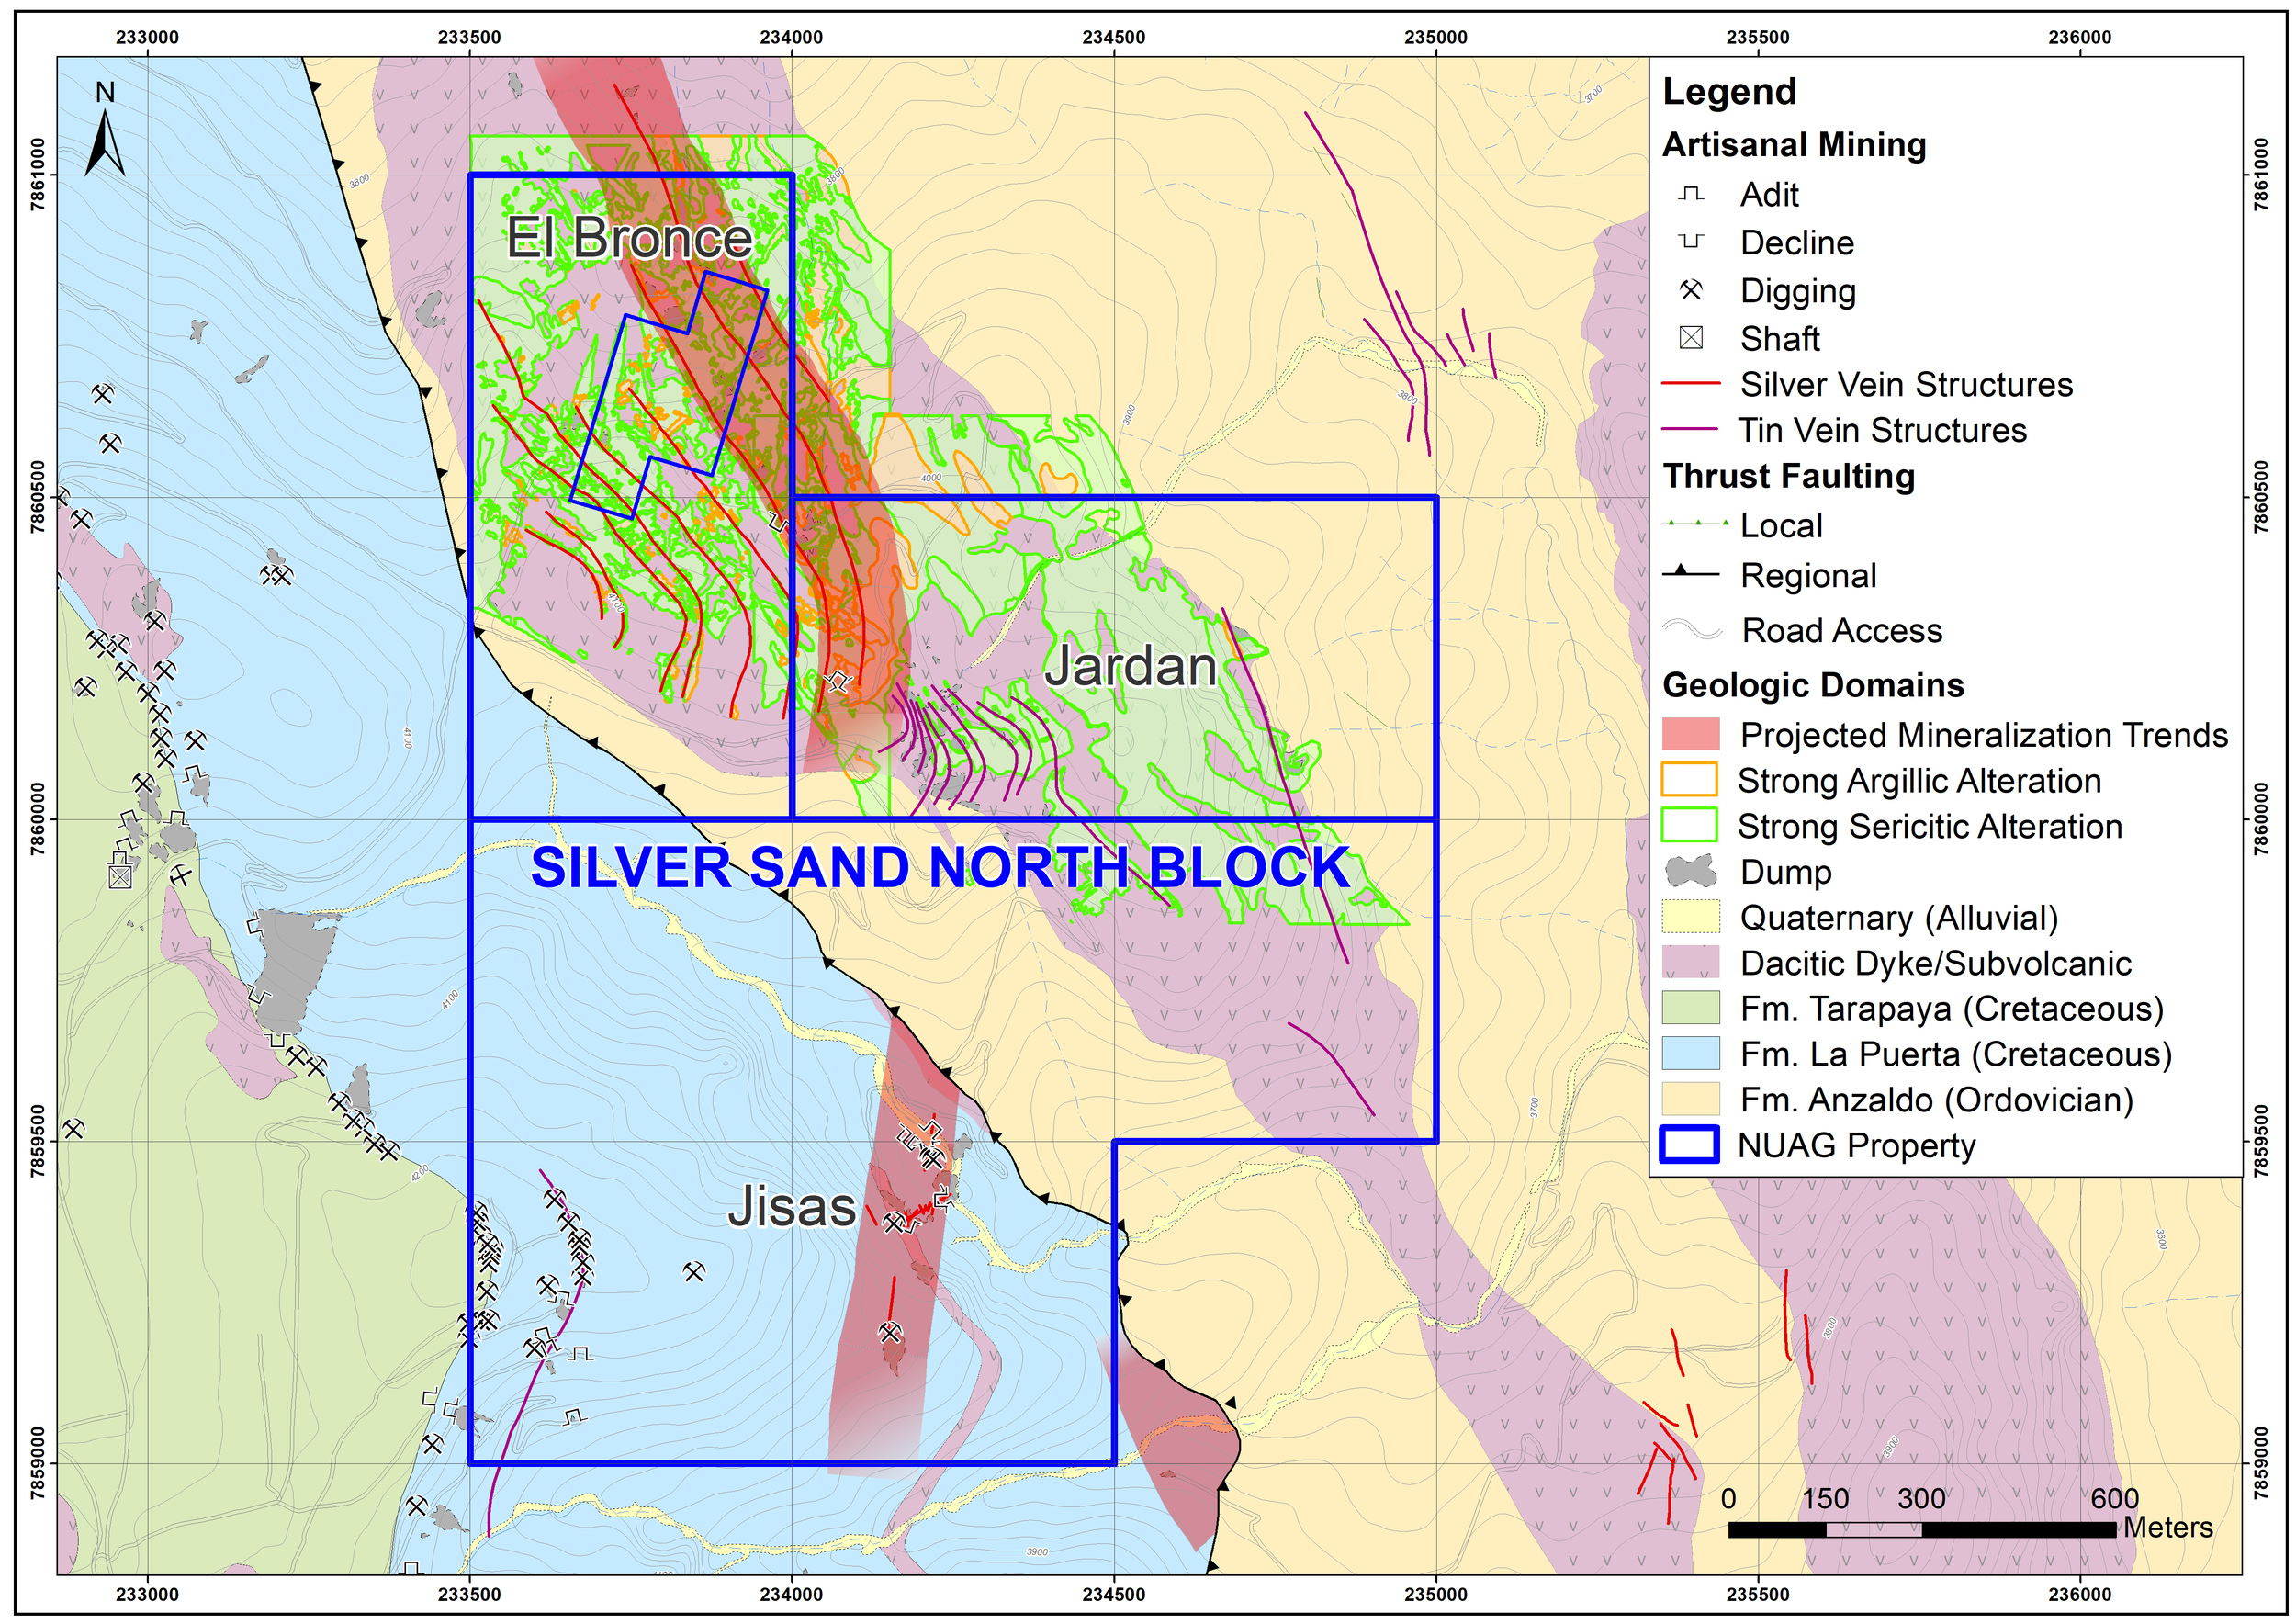
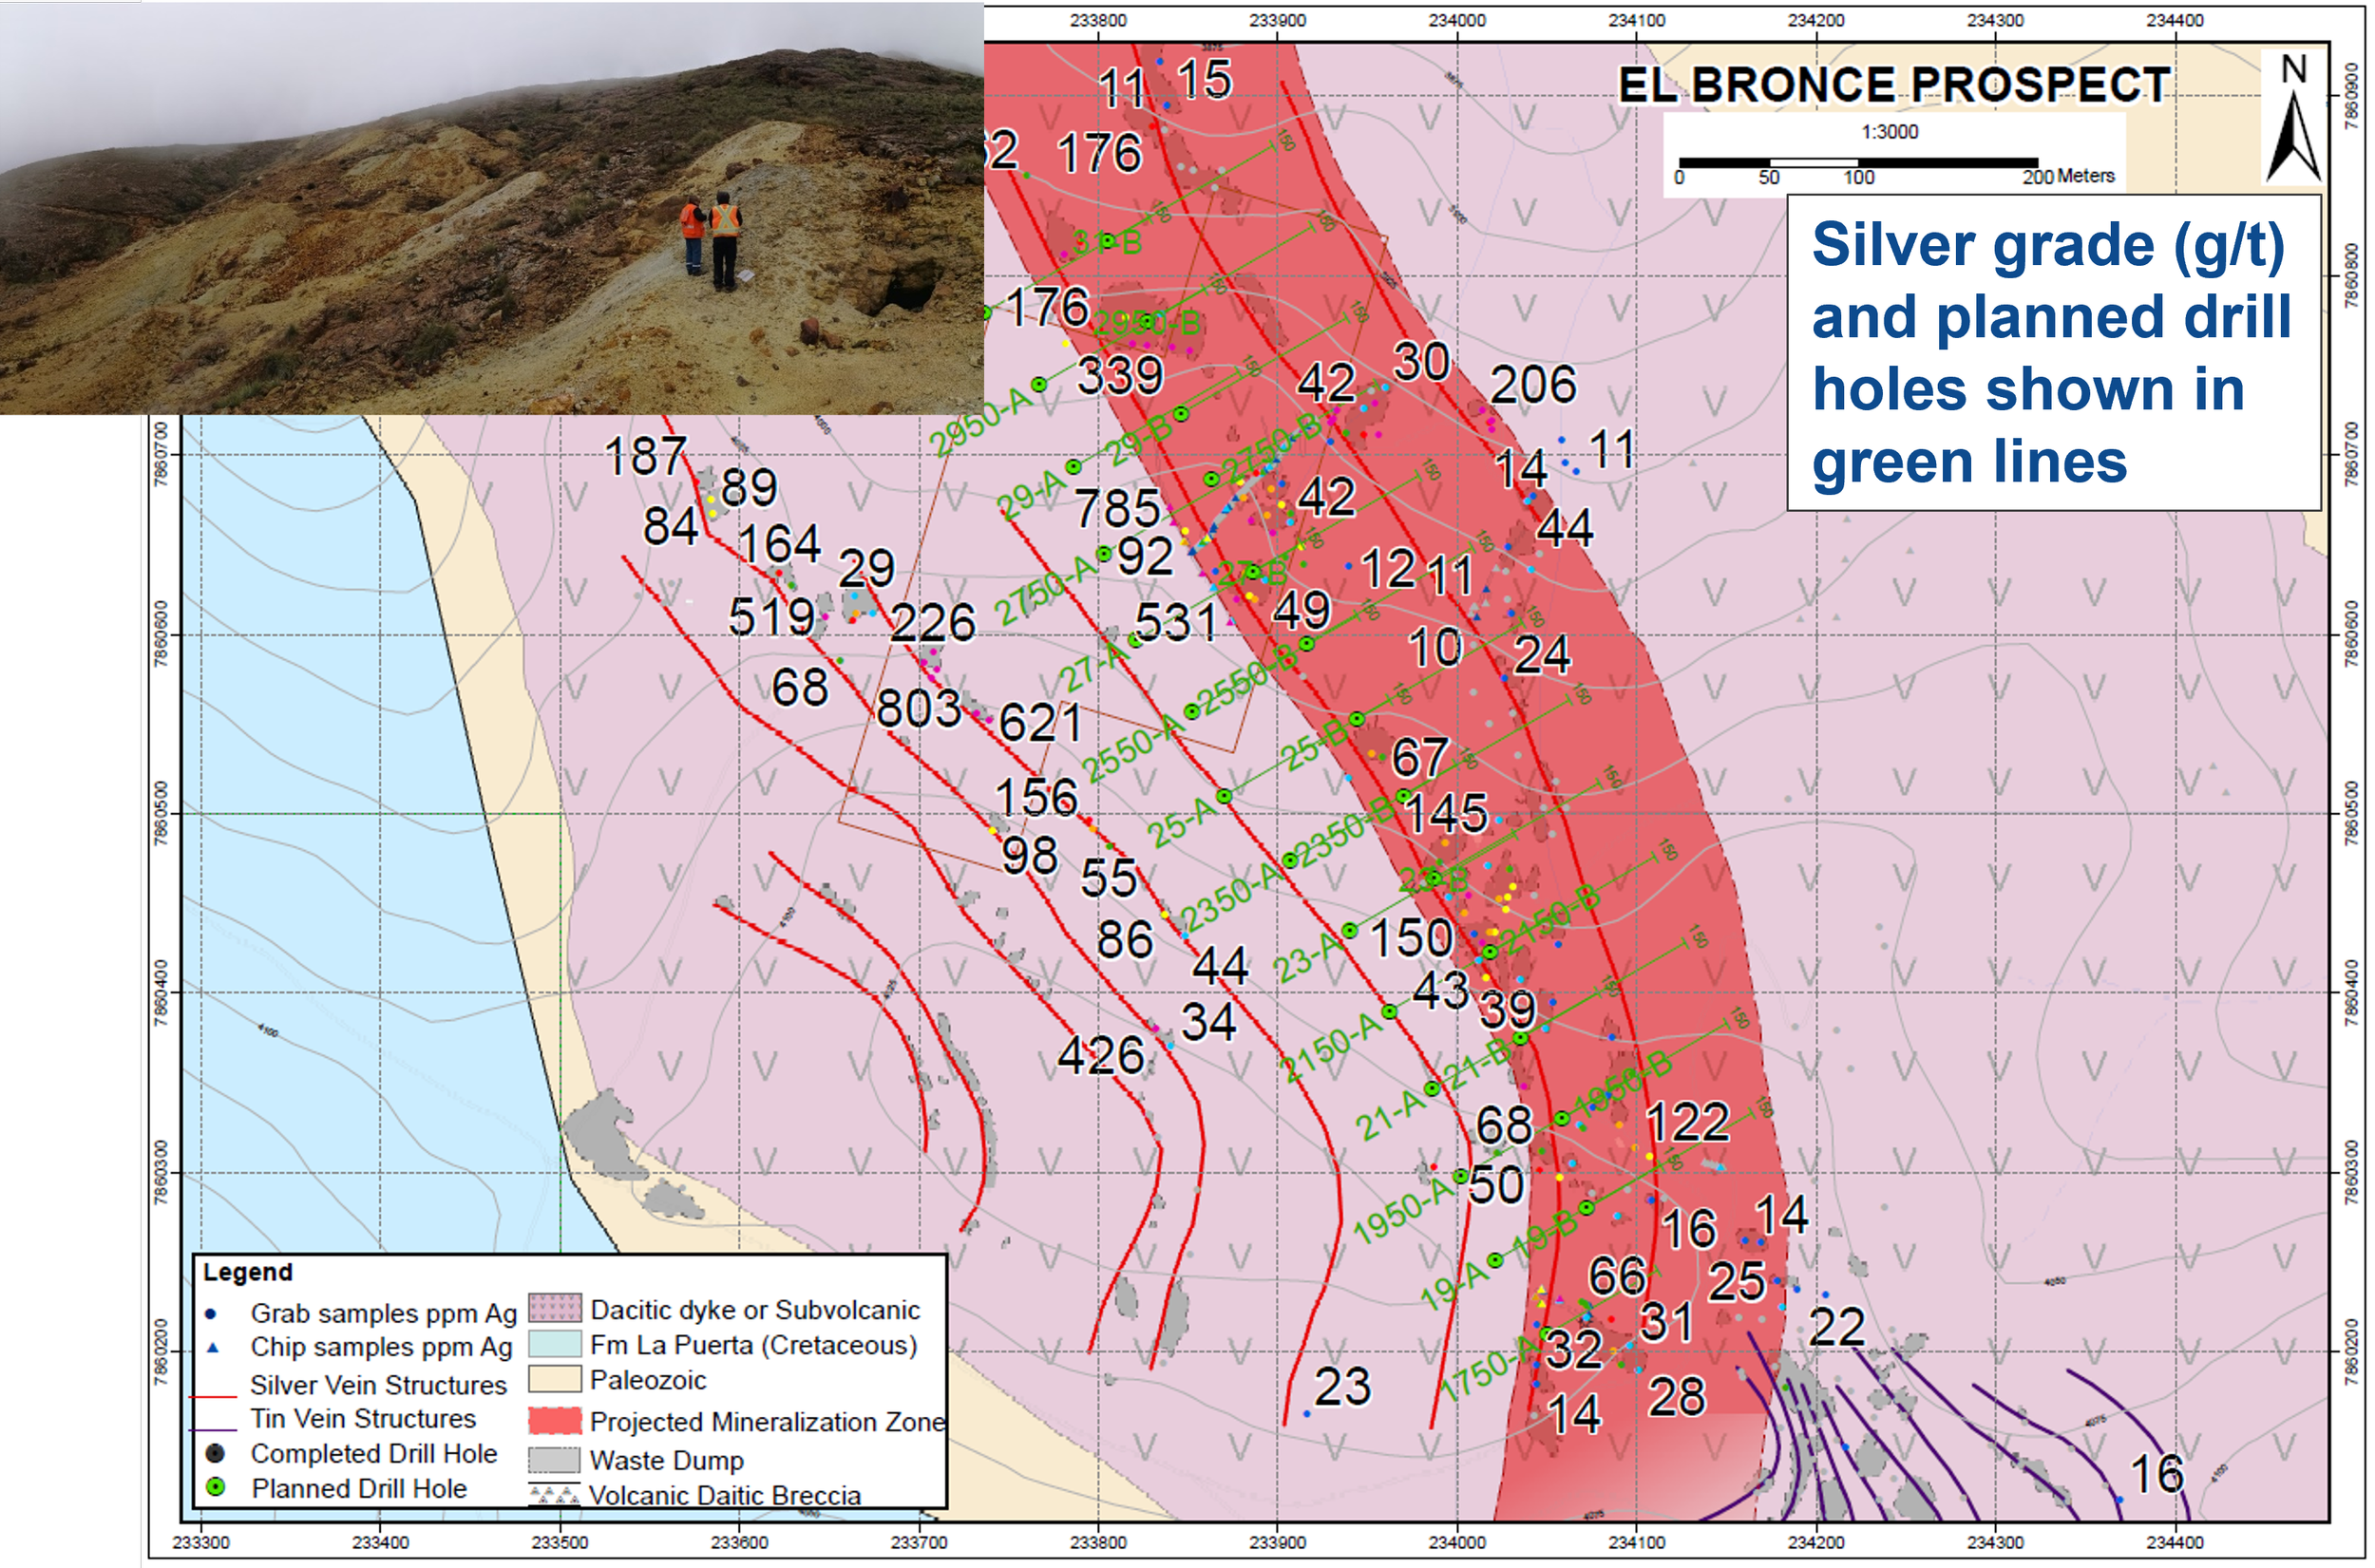
Silver Sand North Blocks (El Bronce, Jardan, Jisas)
The North Block occurs across Cretaceous sandstone terrains and the Eastern Intrusive Trend at district scale. The geology of the North Block differs considerably from that of Silver Sand as it contains both sandstone units and dacitic intrusive rocks. Notably, the El Bronce property contains numerous historic mine workings that exploited both steeply dipping and flat-lying, high-grade, silver-rich polymetallic veins over an area approximately 500 m wide by 1 km long in strike. Detailed geological mapping indicates that the intrusive host rocks are pervasively flooded by moderate to intense alteration, reflecting the passage of silver-rich hydrothermal fluids (phylic alteration (sericite) with local argillic (kaolinite) and propylitic (chlorite-epidote) zones). Surface mapping has also identified good to moderate micro-veining and stockwork development between the principal historically exploited structures, thereby forming an attractive bulk tonnage target. In contrast to El Bronce, the mineralization of Jisas is hosted in numerous open fractures developed in bleached Cretaceous quartz sandstones, similar to that of the Silver Sand core area. Jisas has seen small-scale underground mining before its acquisition by the Company. Chip samples from surface outcrops and underground workings as well as grab samples from mining dumps taken by the Company returned silver grades ranging from tens of grams up to nine hundred grams per ton.
Importantly, the geology, alteration, and style of existing silver mineralization at the North Block provide compelling evidence that the Silver Sand deposit forms part of a larger regional to district-scale, silver-rich, hydrothermal system or systems whose exploration potential remains to be unlocked.
New Pacific recently commenced a 5,000 m drill campaign at both Jisas and El Bronce prospects. Drill results will be released once available.
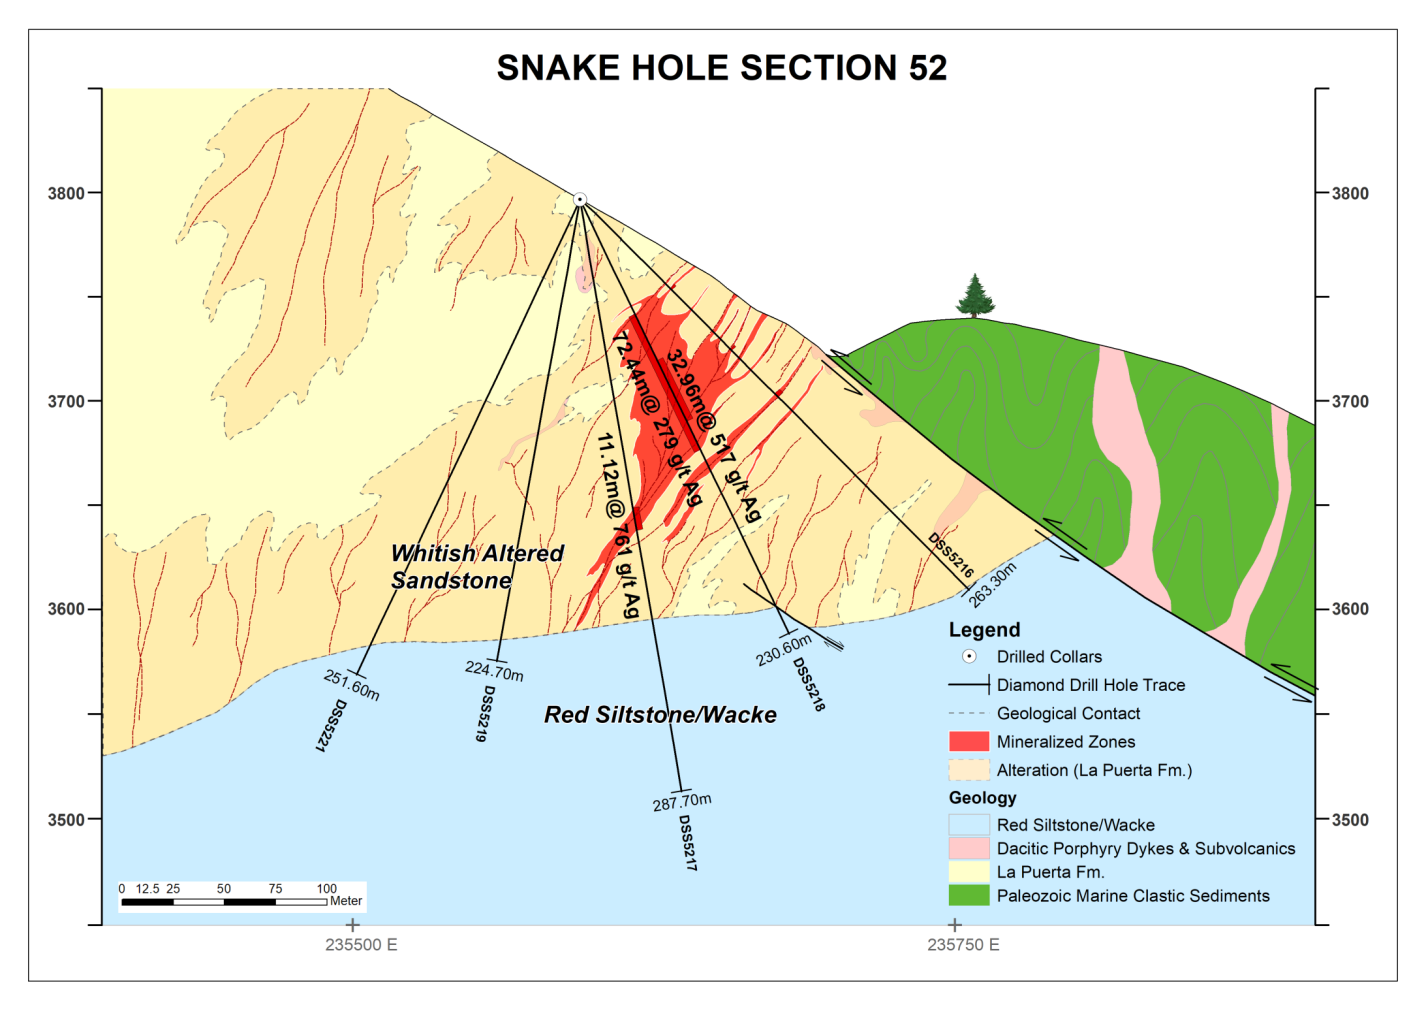
Snake Hole
The Snake Hole prospect is located approximately 600 metres east of the core area of the Silver Sand Project and consists of artisanal underground workings on structures that trend NNW-SSE. The workings and associated surface mine dumps were started in the Spanish colonial era and have continued sporadically to recent times. Developed in altered (bleached) quartz sandstones, the workings are traceable over more than 1,000 metres strike length with widths varying from a few metres up to 100 metres. Geochemical sampling of the workings and mine dumps returned encouraging results, typically ranging from 100g/t Ag to 300g/t Ag.
Surface mapping suggests that the mineralized fracture zone remains open to the north, where it potentially trends undercover towards the Company’s Jisas prospect located approximately two kilometres to the northwest.
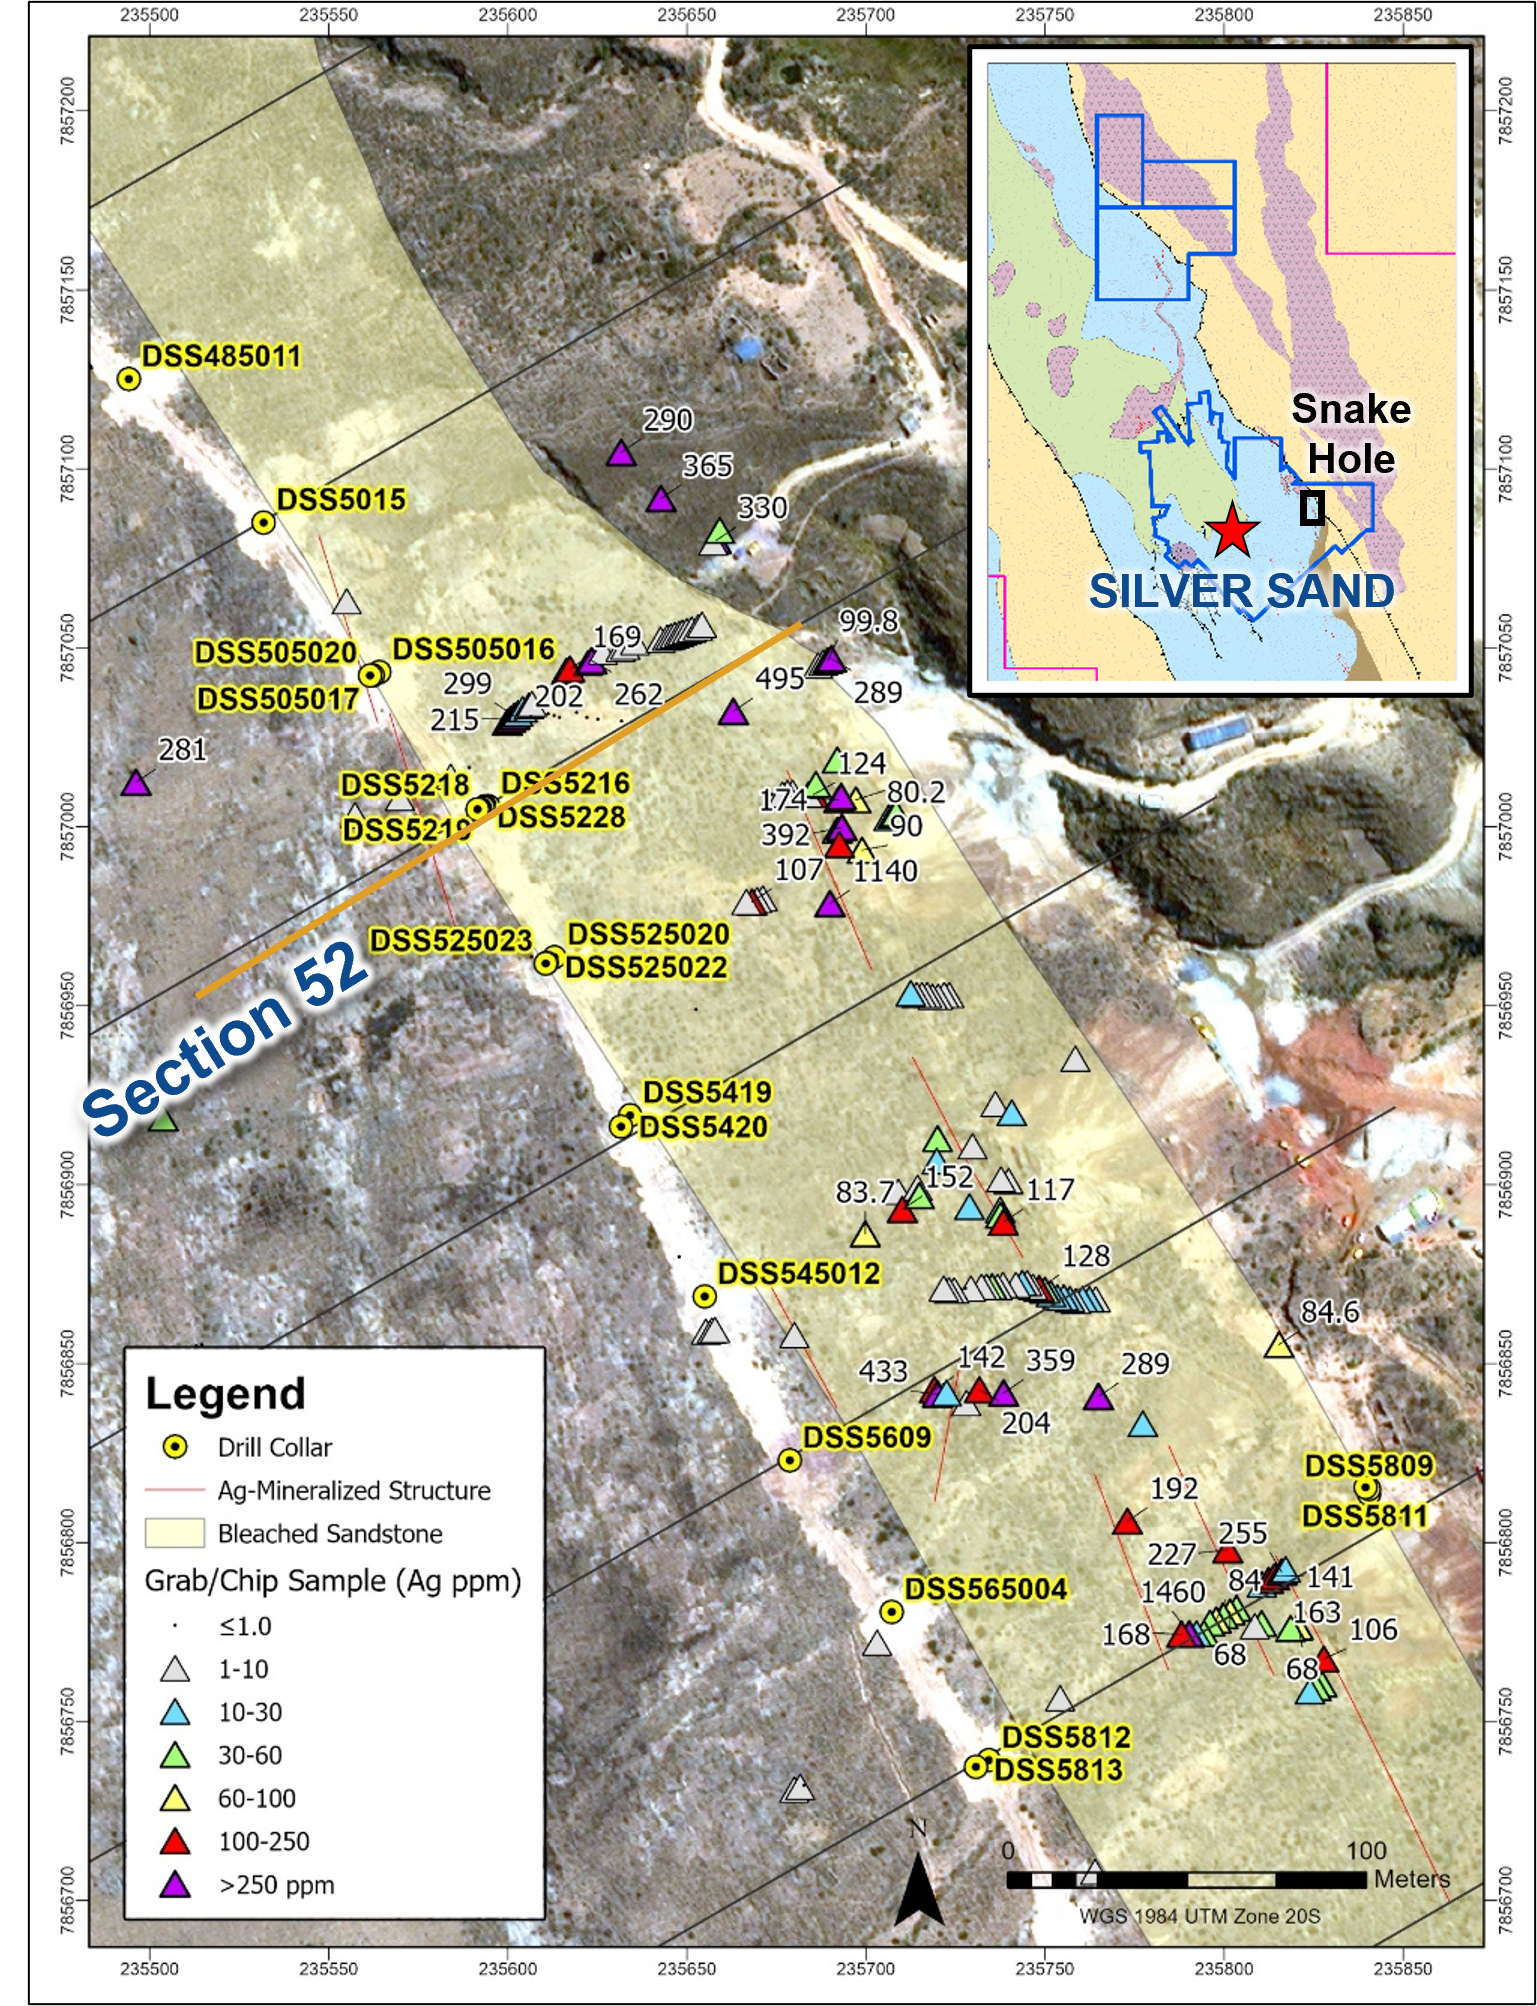
Exploration drilling commenced in late August 2019 and a total of 24 drill holes (~6,000 m) were completed by December 2019. This initial campaign drill tested ~750 metres of the structural zone. Drilling intersected silver mineralization consisting of coarse-grained sulfosalts (freibergite) in fractures of bleached sandstones with associated disseminated pyrite. Grade and thickness of mineralization increase to the north.
During the first quarter of 2020, the Company completed eight additional holes (~1,600 m) at the Snake Hole prospect, aiming to confirm the continuity of silver mineralization and continuing to explore the >1,000 m mineralized trend. Seven of the eight holes intersected structurally controlled silver mineralization. Drill results confirm the continuity of silver mineralization between the holes on section 52, where the initial discovery at Snake Hole was made in 2019.
Drill highlights are as follows:
-
DSS5218 – 72.44 m @ 279 g/t Ag from 60.5 m to 132.94 m, including 32.96 m @ 517 g/t Ag from 84.95 m to 117.9 m.
-
DSS525020 – 38.4 m @ 143 g/t Ag from 29.9 m to 68.3 m, including 6.2 m @ 749 g/t Ag from 36.8 m to 43.0 m.
-
DSS5217 – 11.12 m @ 761 g/t Ag from 149.48 m to 160 m.
-
DSS5228 – 39.39 m @ 126 g/t Ag from 57.91 m to 97.30 m, including 12.26 m @ 354 g/t Ag from 78.33 m to 90.59 m.
-
DSS5228 – 39.39 m @ 126 g/t Ag from 57.91 m to 97.30 m, including 12.26 m @ 354 g/t Ag from 78.33 m to 90.59 m.
-
DSS525022– 16.53 m @ 107 g/t Ag from 137.50 m to 154.03 m, including 7.80 m @ 216 g/t Ag from 137.50 m to 145.30 m.
The scientific and technical information contained herein has been reviewed and approved by Alex Zhang, P. Geo., Vice President of Exploration, who is a Qualified Person for the purposes of National Instrument 43-101 — Standards of Disclosure for Mineral Projects (“NI 43-101”). The Qualified Person has verified the information disclosed herein using standard verification processes, including the sampling, preparation, security and analytical procedures underlying such information, and is not aware of any significant risks and uncertainties or any limitations on the verification process that could be expected to affect the reliability or confidence in the information discussed herein.
Please see the full text of New Pacific Metals Corp. news releases dated June 7, 2022, and August 6, 2020, and NI 43-101 Technical Report titled “Silver Sand Deposit Mineral Resource Report (Amended)”, with a January 16, 2020 effective date and a June 3, 2020 amended date for details.